prevailing winds
our thanks
www.raa.asn.au
(Copyright John Brandon)
General global circulation
As the Earth does continue to
rotate at a constant rate, and the winds do continue, the transfer of momentum
between Earth/atmosphere/Earth must be in balance; and the angular velocity of
the system maintained. (The atmosphere is rotating in the same direction as the
Earth but westerly winds move faster and easterly winds move slower than the
Earth's surface. Remember winds are identified by the direction they are coming
from not heading to!)
The
broad and very deep band of fast-moving westerlies in the westerly wind belt,
centred around 45°S (but interrupted at intervals by migrating cyclones
moving east but not shown in the schematic above) lose momentum to the Earth
through surface friction; resulting in the Southern Ocean's west wind drift
surface current. The equatorial easterlies or trade winds, and to a lesser
extent the polar easterlies, gain momentum from the Earth's surface. That gain
in momentum is transferred, to maintain the westerlies, via large atmospheric
eddies and waves – the sub-tropical high and the sub-polar low belts.
These eddies and waves are also
a part of the mechanism by which excess insolation heat energy is transferred
from the low to the higher latitudes.
Globally the equatorial low
pressure trough is situated at about 5°S during January and about 10°N during
July. Over the Pacific the trough does not shift very far from that average
position, but due to differential heating it moves considerably further north
and south over continental land masses.
The low level air moving towards
the trough from the sub-tropical high belts at about 30°S and 30°N is deflected
by Coriolis and forming the south-east and north-east trade winds. Coriolis
effect deflects air moving towards the equator to the west and air moving away
from the equator to the east.
Cross section of tropospheric circulation
The intertropical convergence zone and the
Hadley cell
The trade winds converging at a
high angle at the equatorial trough, the "doldrums", form the
intertropical convergence zone [ITCZ]. The air in the trade wind belts is
forced to rise in the ITCZ and large quantities of latent heat are released as
the warm, moist maritime air cools to its condensation temperature. About half
the sensible heat transported within the atmosphere originates in the 0 – 10°N
belt; and most of this sensible heat is released by condensation in the towering
cumulus rising within the ITCZ
A secondary convergence zone
of trade-wind easterlies, the South Pacific convergence zone, branches off the
ITCZ near Papua-New Guinea extending south-easterly and showing little seasonal
change in location or occurrence.
Over land masses the trade winds
bring convective cloud which develops into heavy layer cloud with embedded
thunderstorms when the air mass is lifted at the ITCZ.
The ITCZ is the boiler room of
the Hadley tropical cell which provides the circulation forming the
weather patterns, and climate, of the Southern Hemisphere north of 40°S. The
lower level air rises in the ITCZ then moves poleward at upper levels – because
of the temperature gradient effect – and is deflected to the east by Coriolis,
at heights of 40 000 – 50 000 feet, while losing heat to space by radiative
cooling.
The cooling air subsides in the
sub-tropic region, warming by compression and forming the sub-tropical high
pressure belt. Part of the subsiding air returns to the ITCZ as the south-east
trade winds thus completing the Hadley cellular cycle.
(The system is named after George Hadley
[1685-1768], a British meteorologist who formulated the trade wind theory)
At latitudes greater than about
30°S the further southerly movement of Hadley cell air is limited by instability
due to conservation of momentum effects and collapses into the Rossby wave
system described in section 4.7 below. The Hadley cell and the Rossby wave
system, combined with the the cold, dry polar high pressure area over the
elevated Antarctic continent, dominate the Southern Hemisphere atmosphere. Fifty
per cent of the Earth's surface is contained between 30°N and 30°S so the two
Hadley cells directly affect half the globe.
The subsiding high level air of
the Hadley cell forms the persistent sub-tropical high pressure belt, or ridge,
encircling the globe and usually located between 30°S and 50°S. Within the belt
there are three semi-permanent year-round high pressure centres in the South
Indian, South Pacific and South Atlantic Oceans.
In winter the high pressure belt
moves northward.
The Indian Ocean centre produces
about 40 anticyclones annually which, as they develop, slowly pass from west to
east with their centres at about 38°S in February and about 30°S in September.
The anticyclones, or warm-core highs, are generally large, covering 10°
of latitude or more, roughly elliptical, vertically extensive and persistent,
with the pressure gradient weakening towards the centre. The anticyclones are
separated by lower pressure troughs each containing a cold front.
Winds move anticlockwise around
the high, with easterlies on the northern edge and westerlies on the southern
edge. Air moving equatorward on the eastern side is colder than air moving
poleward on the western side. The high level subsiding air spreads out chiefly
to the north and south of the ridge due to the higher surface pressures in the
east and west.
Rossby waves and the westerly wind belt
Upper westerlies blow over most
of the troposphere between the ITCZ and the upper polar front but are
concentrated in the westerly wind belt where they undulate north and south in
smooth broad waves with one, two or three semi-stationary, long wave, peaks and
troughs occurring during each global circumnavigation and a number of distinct
mobile short waves; each about half the length of the long waves.
The amplitude of these mobile
Rossby waves, as shown on upper atmosphere pressure charts, varies
considerably and can be as much as 30° of latitude. Then the airflow rather than
being predominantly east/west will be away from or towards the pole. The
gradient wind speed in the equatorward swing will be super-geostrophic and the
speed in the poleward swing will be sub-geostrophic. The poleward swing of each
wave is associated with decreasing vorticity and an upper level high pressure
ridge and the equatorward swing associated with increasing vorticity and an
upper trough.
Downstream of the ridge upper
level convergence occurs, with upper level divergence downstream of the trough.
This pattern of the Rossby waves in the upper westerlies results in compensating
divergence and convergence at the lower level, accompanied by vorticity and the
subsequent development of migratory surface depressions – lows or cyclones (cyclogenesis)
and the development of surface highs or anticyclones (anticyclogenesis).
The long waves do not usually
correspond with lower level features; being stable and slow moving, stationary
or even retrograding. However they tend to steer the more mobile movement of the
short waves which, in turn, steer the direction of propagation of the low level
systems and weather.
The swings of the Rossby waves
carry heat and momentum towards the poles and cold air away from the poles. The
crests of the short waves can break off leaving pools of cold or warm air,
assisting in the process of heat transfer from the tropics. Wave disturbances at
the polar fronts perform a similar function at lower levels.
An upper level pool of cold air,
an upper low or cut-off low or upper air disturbance, will
lead to instability in the underlying air. The term cut-off low is also applied
to an enclosed region of low surface pressure which has drifted into the high
pressure belt, i.e. cut off from the westerly stream, or is cradled by
anticyclones and high pressure ridges. Similarly the term cut-off high is
also applied to an enclosed region of high surface pressure cut off from the
main high pressure belt (refer 'blocking pairs' section 5.2) and to an upper
level pool of warm air which is further south than normal – also termed upper
high.
The upper air thickness
charts, used in aviation flight planning, show the vertical distance between
two isobaric surfaces, usually 1000 hPa is the lower, and the upper may be 700
hPa, 500 hPa or 300 hPa. The atmosphere in regions of less thickness, upper
lows, will be unstable and colder whereas regions of greater thickness, upper
highs, tend to stability. On these charts winds blow almost parallel to the
geopotential height lines.
Upper Air Winds and the Jet
Streams
Winds at the top of the
troposphere are generally poleward and westerly in direction. The figure below
describes these upper air westerlies along with some other associated weather
features. Three zones of westerlies can be seen in each hemisphere on this
illustration. Each zone is associated with either the Hadley,
Ferrel, or Polar circulation cell.
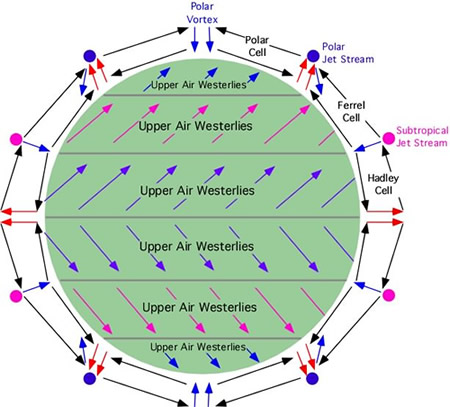
Simplified global three-cell upper air circulation patterns.
The polar jet stream is
formed by the deflection of upper air winds by coriolis acceleration. It
resembles a stream of water moving west to east and has an altitude of about 10
kilometres. Its air flow is intensified by the strong temperature and pressure
gradient that develops when cold air from the poles meets warm air from the
tropics. Wind velocity is highest in the core of the polar jet stream where
speeds can be as high as 300 kilometres per hour. The jet stream core is
surrounded by slower moving air that has an average velocity of 130 kilometres
per hour in winter and 65 kilometres per hour in summer.
Associated with the polar jet
stream is the polar front. The polar front represents the zone where warm
air from the subtropics (pink) and cold air (blue)
from the poles meet. At this zone, massive exchanges of energy occur in the form
of storms known as the mid-latitude cyclones. The shape and position of
waves in the polar jet stream determine the location and the intensity of the
mid-latitude cyclones. In general, mid-latitude cyclones form beneath polar jet
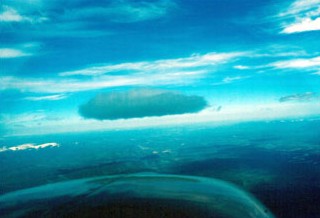
stream troughs. The following satellite image, taken from above
the South Pole, shows a number of mid-latitude cyclones circling Antarctica.
Each mid-latitude cyclone wave is defined by the cloud development associated
with frontal uplift.
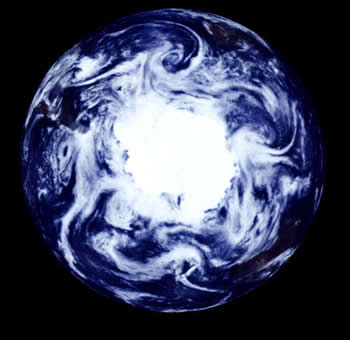
Satellite view of the atmospheric circulation at the South Pole.
(Source: NASA)
The subtropical jet stream
is located approximately 13 kilometres above the subtropical high pressure
zone. The reason for its formation is similar to the polar jet stream.
However, the subtropical jet stream is weaker. Its slower wind speeds are the
result of a weaker latitudinal temperature and pressure gradient.
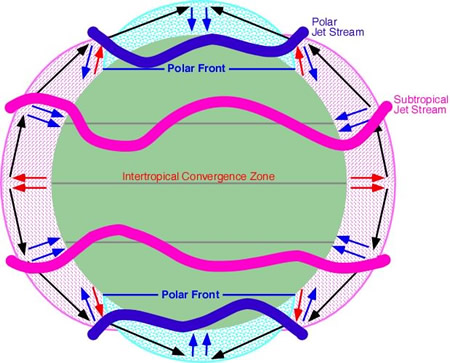
Polar and subtropical jet streams.
surface winds
An air parcel initially at
rest will move from high pressure to low pressure because of the pressure
gradient force (PGF). However, as that air parcel begins to move, it is
deflected by the Coriolis force to the right in the northern hemisphere (to
the left on the southern hemisphere). As the wind gains speed, the deflection
increases until the Coriolis force equals the pressure gradient force. At this
point, the wind will be blowing parallel to the isobars. When this happens,
the wind is referred to as geostrophic.
Geostrophic wind blows parallel
to the isobars because the Coriolis force and pressure gradient force are in
balance. However it should be realized that the actual wind is not always
geostrophic -- especially near the surface.
The surface of the Earth exerts a frictional
drag on the air blowing just above it. This friction can act to change the
wind's direction and slow it down -- keeping it from blowing as fast as the wind
aloft. Actually, the difference in terrain conditions directly affects how much
friction is exerted. For example, a calm ocean surface is pretty smooth, so the
wind blowing over it does not move up, down, and around any features. By
contrast, hills and forests force the wind to slow down and/or change direction
much more.
As we move higher, surface features affect the
wind less until the wind is indeed geostrophic. This level is considered the top
of the boundary (or friction) layer. The height of the boundary layer can vary
depending on the type of terrain, wind, and vertical temperature profile. The
time of day and season of the year also affect the height of the boundary layer.
However, usually the boundary layer exists from the surface to about 1-2 km
above it.
In the friction layer, the
turbulent friction that the Earth exerts on the air slows the wind down. This
slowing causes the wind to be not geostrophic. As we look at the diagram above,
this slowing down reduces the Coriolis force, and the pressure gradient force
becomes more dominant. As a result, the total wind deflects slightly towards
lower pressure. The amount of deflection the surface wind has with respect to
the geostrophic wind above depends on the roughness of the terrain.
Meteorologists call the difference between the total and geostrophic winds
ageostrophic winds.
land and sea breezes
www.islandnet.com
As the day dawns, coastal
skies are cloudless or nearly cloudless, and the wind induced by large-scale
weather patterns is light. As the sun rises, increased solar energy heats the
surface of the earth which, in turn, heats the lowest layers of the
atmosphere. At sea, however, the radiant energy received is rapidly dispersed
by a combination of turbulent mixing due to winds. waves, currents and the
capacity of the water to absorb great quantities of heat with only slight
alteration of its temperature. Thus. the air over land warms faster than that
over the sea surface. Since warmer air is lighter air, the pressure over land
becomes less than that over water, the average value of this difference being,
during the sea breeze regime, about 1 millibar. [1013 millibars = 1 atmosphere
of pressure]
- Warm air over land rises
- Sea Breeze moves inland
- Cumuli develop aloft and move seaward
- Upper level return land breeze
- Cool air aloft sinks over water
- Sea Breeze (meso-cold) Front
|
A few hours after sunrise, the
pressure gradient will have built up sufficiently to allow the sea breeze to
begin moving inland. As the sea breeze moves inland, the cooler sea air advances
like a cold front characterized by a sudden wind shift, a drop in temperature
and a rise in relative humidity. A temperature drop of 2 to 10 C degrees (3.6 to
18 F degrees) within 15 to 30 minutes is not an uncommon occurrence as the
sea breeze front advances.
Thus, in the tropics, the sea
breezes make coastal areas more comfortable and healthy for human habitation
than the inland regions.
From the time of the sea breeze
front passage until late afternoon. the wind will blow inland at speeds of 13 to
19 kilometres per hour (8 to 12 miles per hour), occasionally as strong as 40
kilometres per hour (25 miles per hour). At first, the wind blows perpendicular
to the shore, but as the day wears on, friction and Coriolis effects act to veer
the wind until it parallels the coastline. The landward penetration of the sea
breeze reaches 15 to 50 kilometres (9 to 30 miles) in the temperate zones and 50
to 65 kilometres (30 to 40 miles) in the tropics. By late afternoon, the
strength of the sea breeze slowly diminishes as the influx of solar energy
lessens. The decay of the circulation pattern occurs first at the shoreline and
then proceeds further inland.
The Land Breeze
As the sun sets, cooling begins
along the surface of the land and sea. Like daytime heating, cooling occurs at
different rates over water and land. The rapidly cooling land soon has a higher
air pressure over it relative to that over the sea, and the air begins to flow
down the pressure gradient seaward. This is the land breeze. It too is
influenced by the roughness of the coastline, strength of the large-scale winds,
and coastal configuration. Unlike the sea breeze, the land breeze is usually
weaker in velocity and less common. The land breeze is often dominant for only a
few hours and its direction is more variable. Nevertheless, the land breeze can
penetrate the marine atmosphere for 10 kilometres (6 miles) seaward.
- Cool air over land sinks
- Land Breeze moves out over water
- Relatively warmer water heats air which
then rises
- Upper level return sea breeze
- Cool air over land sinks
|
Climatology of the Sea and Land
Breeze
The sea breeze is most common
along tropical coasts, being felt on about 3 out of 4 days. The warmer
temperatures, increased solar radiation and generally weaker prevailing winds in
the low latitudes promote the development of the sea breeze. In general, the
climatic significance of the sea breeze decreases with latitude. In temperate
regions, it is generally a phenomenon of late spring and summer when atmospheric
conditions (higher temperatures, weaker large-scale winds) are most favourable
to the formation of the thermally induced, sea-land circulation system.
The land breeze occurs less
frequently. Along coasts with steep shorelines or volcanic island coasts,
however, it may be the dominant partner with speeds in excess of 32 kilometres
per hour (20 miles per hour). The land breeze may also occur in the temperate
regions during the cold season, especially when a warm current flows along the
coast.
Lake-Land Breezes
Lake may also develop a similar
local wind circulation pattern. Here the inland moving wind is known as the
lake breeze. Lake breezes are quite common in late spring and summer, for
example, along the shorelines of the Great Lakes, providing local residents with
a place of refuge during hot, humid summer days.
mountain winds
Hills and valleys substantially
distort the airflow associated with the prevailing pressure system
and the pressure
gradient. Strong up and down drafts and eddies develop as the air flows up
over hills and down into valleys. Wind direction changes as the air
flows around hills. Sometimes lines of hills and mountain ranges will
act as a barrier, holding back the wind and deflecting it so that it flows
parallel to the range. If there is a pass in the mountain range, the
wind will rush through this pass as through a tunnel with considerable speed.
The airflow can be expected to remain turbulent and erratic for some
distance as it flows out of the hilly area and into the flatter
countryside.
Daytime heating and night-time
cooling of the hilly slopes lead to day to night variations in the
airflow. At night, the sides of the hills cool by radiation. The
air in contact with them becomes cooler and therefore denser and it blows down
the slope into the valley. This is a katabatic wind (sometimes
also called a mountain breeze). If the slopes are covered with ice and
snow, the katabatic wind will blow, not only at night, but also during the
day, carrying the cold dense air into the warmer valleys. The slopes of
hills not covered by snow will be warmed during the day. The air in contact
with them becomes warmer and less dense and, therefore, flows up the slope.
This is an anabatic wind (or valley breeze).
In mountainous areas, local
distortion of the airflow is even more severe. Rocky surfaces, high
ridges, sheer cliffs, steep valleys, all combine to produce unpredictable flow
patterns and turbulence.
the mountain wave
|
mountain wave
formation
perpendicular wind
flow
increasing wind velocity
stable layer or inversion
|
The U.S. Aeronautical Information
Manual states, “Your first experience of flying over
mountainous terrain, particularly if most of your flight time has been
over the flatlands of the Midwest, could be a never-to-be-forgotten
nightmare if you are not aware of the potential hazards awaiting … Many
pilots go all their lives without understanding what a mountain wave is.
Quite a few have lost their lives because of this lack of understanding.
One need not be a licensed meteorologist to understand the mountain wave
phenomenon.”
The most distinctive characteristic
of the mountain wave is the lenticular cloud. This is a "signpost of the
sky" indicating that mountain wave activity is present.
there are several terms for mountain wave:-
The wave that forms over the
mountain is more properly called the "mountain wave." The waves downwind
from the mountain are the "standing wave" or "lee wave." Pilots have come
to accept all of these names for wave activity, regardless of position of
the lenticular clouds.
To set up a mountain wave condition three
elements are needed:
-
Wind flow perpendicular to the
mountain range, or nearly so, being within about 30 degrees of
perpendicular.
-
An increasing wind velocity
with altitude with the wind velocity 20 knots or more near
mountaintop
level.
-
Either a stable air mass layer
aloft or an inversion below about 15,000
feet.
Because of these elements, the
weather service is able to predict the mountain wave condition with over
90-percent accuracy.
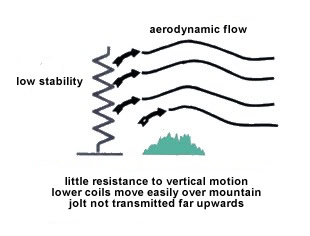
Figure
1
In figure 1, we have likened an atmosphere with
low stability to a flimsy spring that offers little resistance to vertical
motion. So while the lower coils move easily up and over the mountain, the
jolt received at ground level is not transmitted very far
upward.
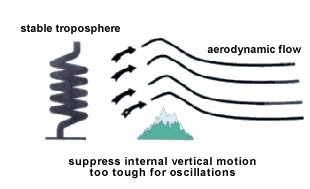
Figure 2
Figure 2 represents a stable atmosphere that is
similar to a tough, heavy spring. This air, when it strikes the mountains,
tends to suppress internal vertical motion. It is essentially too tough
for oscillations to be set up.
Figure
3
In figure 3 we have an arrangement of a strong
coil sandwiched between two weaker springs to simulate an atmosphere with
a stable layer sandwiched between areas of lesser stability. With this
arrangement it is conceivable that the strong spring will continue to
bounce up and down for some time after the parcel of air has crossed the
mountain ridge. With a stable layer (or inversion aloft) the air stream is
both flexible enough to be set in vertical motion and elastic enough to
maintain that motion as a series of vertical oscillations.
As the air ascends, it cools and condenses out
moisture, forming the distinctive lenticular clouds. As it descends, it
compresses and the heat of compression reabsorbs the moisture. It goes
through this up and down action many times forming a distinctive
lenticular cloud at the apex of each crest, providing there is sufficient
moisture present for the cloud formation.
|
Wave length
-
directly proportional
to wind speed
-
Inversely proportional
to stability
-
Intermountain West -
averages 4 miles
-
Appalachia Wave -
averages 10 miles
|
|
|
Lee Wave
Variation
-
Diurnal variation:
in the summer early morning or late afternoon is best for formation
-
Seasonal variation:
winter is the best time for formation (jet stream, snow covered
ground = no convection, stable layer aloft)
|
|
The up-and-down action forms a
trough at the bottom of its flow and a crest at the top of the flow. The
distance from trough to trough (or crest to crest) is called the wave
length. The wave length is directly proportional to wind wind and
inversely proportional to stability.
The wave length is used for
visualization. In the area from the trough to the crest is an area of
updrafts. The area from the crest to the trough is predominately
downdrafts.
In the intermountain west the wave
length can vary from about 2 nautical miles to over 25 nautical miles. It
averages 8 miles and extends downrange about 150-300 nautical miles.
Satellite photos have shown the wave capable of extending over
700-nautical miles downwind from the mountain range.
|
|
|
|
Cap cloud of the Teton mountain range This cloud is mostly
on the windward side of the mountain. |
Foehngap
The foehngap exists because moisture
is reabsorbed during the down rush of air. |
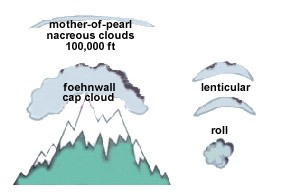
With sufficient moisture three typical
wave clouds will form, although there are four types of clouds associated
with the wave.
 Cap cloud (foehnwall)
Lenticular
Roll (rotor, arcus)
Mother-of-Pearl
The presence of clouds merely point out
wave activity and not wave intensity at any particular level. Because
moist air takes less vertical distance to reach its condensation level
than does dryer air, the presence of a lenticular cloud is not necessarily
an indication of the strength of the updrafts or downdrafts in a mountain
wave.
For example, high altitude lenticulars may
indicate there is sufficient moisture at that altitude to form them, when
in fact the strongest wave lift and sink occurs at a lower altitude where
there isn't enough moisture to form the lenticular clouds. This is one
reason visualization is so important.
The mother-of-pearl or nacreous cloud is a
pancake-shaped cloud that is extremely thin and visible for only a short
time after sunset or before sunrise when the sky is dark. It is normally
seen in latitudes higher than 50 degree north, or over Antarctica. It is
best seen in the polar regions at 80,000 to 100,000 feet when the sun is
below the horizon.
|
Lenticulars over Montana |
Rotor cloud in Alaska |
The lenticular cloud appears to be stationary
although the wind may be blowing through the wave at 50 knots or more. The
wave lift can extend into the stratosphere, more than 10 miles above sea
level, so you can't escape wave effects by flying over them.
What are the flight conditions in lenticular
clouds? Generally the lenticular area will be quite smooth. The only
danger is the magnitude of the sustained updrafts and downdrafts. Usually
individual lenticulars are composed of ice crystals, but when they are
composed of super-cooled water droplets watch out for severe icing
conditions.
|
Line of rotors - Calgary |
|
mountain
wave safety practices
-
altitude 50%
above terrain
-
approach at 45
degree angle
-
avoid ragged &
irregular lenticulars
-
climb in lift
-
dive in sink
-
avoid the area
of the rotor
-
visualise the
wave length
|
|
Normally the rotor clouds is centred beneath
the lenticular cloud. Most often it extends anywhere from ground level to
mountaintop level, but is frequently observed up to 35,000 feet. Destructive
turbulence from the rotor rarely exists more than 2,000-3,000 feet above
mountaintop level.
The rotor is described as a "dark,
ominous-looking cloud with a rotating appearance." If it forms near the ground
where it can pick up dust and debris, it is dark and ominous looking, but more
often it looks similar to a fair-weather cumulus. Turbulence is most frequent
and most severe in the standing rotors just beneath the wave crests at or below
mountaintop level (visualization is helpful where there is insufficient moisture
to form the rotor or the lenticular).
The rotor area forms beneath the lee wave
where a large swirling eddy forms. Sometimes with an inversion (normally stable
air), turbulence succeeds in overturning the air in the stable layer. Once warm
air is suddenly forced beneath colder and denser air a vigorous convection is
set up in an attempt to restore normal equilibrium. This makes the roll cloud a
particularly turbulent hazard. If the top of the cloud is rotating faster than
the bottom, avoid the area like the plague.
The most dangerous characteristic of the
standing wave is the rotor. The rotor can be assumed to exist whenever a
mountain wave forms, but a cloud will not always form to alert you to its
presence. Avoid the area where the rotor will form with visualization.
Often the three conditions that must exist to
form a mountain wave will exist (perpendicular wind flow, increasing wind
velocity with altitude, and a stable air mass layer or inversion) ... but there
is insufficient moisture for the wave clouds to form. This is called a dry wave.
All of the updrafts, downdrafts and rotor turbulence exists, you just can't see
the clouds. You must use visualization.
Just because a mountain wave exists, it is not
a sure sign that your flight must be delayed or cancelled. The degree of
stability can be determined from pilot reports or by a test flight.
Mountain wave safety practices
Altitude 50 percent above the terrain -
Turbulence caused by extreme mountain waves can extend into all altitudes that
you might use, but dangerous turbulence can usually be avoided by clearing the
mountains at least half again as high as the height of the mountain. In
Colorado there are 54 peaks over 14,000-foot elevation. Does this mean we have
to fly at 14,000 plus one-half (7,000) or 21,000 feet? No, use the base of the
terrain to begin measuring. For example, if the surrounding terrain is 10,000
feet and the mountaintop is 14,000 feet, use one-half of the 4,000-foot value
and fly 2,000 feet above the mountaintops.
Approach at a 45-degree angle - The
rule-of-thumb of flying half again as high as the mountain is designed to
reduce the risk of entering the turbulent rotor zone, but it does not
necessarily give you a sufficient margin to allow for height loss due to
downdrafts. You must have an escape route.
Avoid ragged or irregular-shaped lenticulars
- Ragged and irregular-shaped lenticulars can contain the same turbulence as
the rotor area.
Climb in lift - Dive in sink - By diving in
sink, rather than trying to maintain altitude, the airplane is exposed to the
effects of the downdraft for a lesser amount of time. Even though the rate of
descent will likely be double or more the rate of climbing at the best
rate-of-climb airspeed, the airplane will loose less altitude overall.
Avoid the rotor - If rotor clouds are not
present, visualize the area of the rotor and avoid it.
Visualize the wave length - When flying
parallel to the wave, fly in the updraft area.
eddies - mechanical turbulence
Mechanical turbulence is
determined by both the speed of the wind and the roughness of the surface over
which the air flows. As wind moves through trees or over rough surfaces, the
air is broken up into eddies that make the wind flow irregular. We feel these
irregularities at the surface as abrupt changes in wind speed and direction --
gusts. The eddies can either combine to form larger eddies, or cancel each
other out and lessen the effect.
Thermal influences interact with
mechanical influences. If there is surface heating, an eddy formed by flow
obstructions may be lifted up because the air is unstable. Or the eddy created
could cause instability by mixing air of different temperatures. Each influence
affects the other. Next we will look at some specific examples of microscale
turbulence and flow.
dust devils
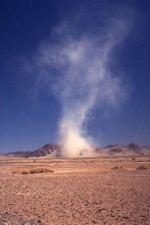
Localized
heating and associated convection can develop into dramatic small scale
vortices. These pick up available dust and debris, creating dust devils.
Localized heating and associated convection can develop into dramatic small
scale vortices. These pick up available dust and debris, creating dust devils. Dust devils pose the greatest hazard near the
ground where they are most violent.
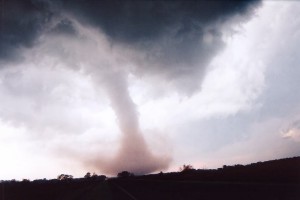
tornadoes
Tornadoes are one of
nature's most violent storms. In an average year, about 1,000 tornadoes are
reported across the United States, resulting in 80 deaths and over 1,500
injuries. A tornado is a violently rotating column of air extending from a
thunderstorm to the ground. The most violent tornadoes are capable of
tremendous destruction with wind speeds of 250 mph or more. Damage paths can
be in excess of one mile wide and 50 miles long.
winds
speeds and direction
Wind speeds for maritime purposes are expressed in knots (nautical miles
per hour). In the weather reports on US public radio and television, however,
wind speeds are given in miles per hour while in Canada speeds are given in
kilometres per hour.
In a discussion of wind
direction, the compass point from which the wind is blowing is considered to
be its direction. Therefore, a north wind is one that is blowing from the
north towards the south.
veering and backing
The terms veering
and backing originally referred to the shift of surface wind
direction with time but meteorologists now use the term when referring to the
shift in wind direction with height. Winds shifting anti-clockwise around the
compass are 'backing', those shifting clockwise are 'veering'. At night, surface
friction decreases as surface cooling reduces the eddy motion of the air.
Surface winds will back and decrease. During the day, as surface friction
intensifies, the surface winds will veer and increase.
wind shear
Air flow in the boundary layer is
normally turbulent to some degree but such turbulence does not significantly
alter the aircraft’s flight path. (Bear in mind that what is a minor variation
in flight path at a reasonable altitude may be hazardous when operating at low
altitude and slower speed – particularly in take-off, landing and 'go-around'
operations.) Practically all turbulence hazardous to flight is a result of
wind shear, a sudden “variation in wind along the flight path of a
pattern, intensity and duration, that displaces the aircraft abruptly from its
intended path and sufficiently that substantial control action is needed.”
The shear is the rate of change of wind speed and direction and its
effect on flight can range from inconsequential to extremely hazardous.
Vertical shear is the change in the (roughly) horizontal wind velocity
with height. i.e. as the aircraft is climbing or descending.
Horizontal shear is the change in horizontal wind velocity ( i.e. speed
and/or direction – gusts and lulls) with distance flown.
Updraught, downdraught or vertical gust shear is the change in vertical
air motion with horizontal distance.
Wind shear can derive from orographic, frictional, air mass instability, wave
disturbance, thermal and jetstream sources. The closer to the surface that the
shear occurs the more hazardous for aircraft, and particularly for aircraft with
low momentum. For an aircraft taking off or landing the shear may be large
enough and rapid enough to exceed the airspeed safety margin and the aircraft’s
capability to accelerate or climb. Thermals as such contribute relatively minor
amounts of hazardous turbulence except when flying at low levels in a
superadiabatic layer. Refer 9.9 below.
Sudden entry into a significant updraught, downdraught or vertical gust is the
most hazardous form of wind shear. Such events are usually associated with large
convective clouds, refer 9.4 below, and the air current will have lateral and
horizontal components in addition to the vertical. The aircraft's inertia will
initially maintain its flight path relative to the surface (or space) so the
aircraft's angle of attack must alter – with a consequent change in the lift and
drag coefficients, plus a change in wing loading. The following table shows the
approximate change in aoa experienced by an aircraft flying at 60 knots [6000
feet per minute] and also 100 knots [10 000 feet per minute], encountering
updraughts or downdraughts with vertical components of various speeds. The
angles are roughly calculated using the 1-in-60 rule.
Approximate change in aoa
Vertical component
of air current |
60 knots
[6000 fpm] |
100 knots
[10 000 fpm] |
| 500 fpm |
5° |
3° |
| 1000 fpm |
9° |
6° |
| 1500 fpm |
15° |
11° |
Thus an aircraft approaching to
land at 60 knots and encountering a 1000 feet per minute downdraught would
experience an initial reduction in aoa of 9°. Presuming that an aircraft on
approach has an aoa of 8° to 10° and looking at the
CL
curve in the Flight Theory basic forces module you can see that a 9° aoa
reduction is going to reduce CL
from a value around 0.9 to about 0.1 which indicates a reduction in lift of at
least 80% and, consequently, the aircraft will initially sink very rapidly –
i.e. at a descent rate greater than the vertical speed of the airstream. The
event becomes hazardous should the rate of downflow exceed the aircraft's rate
of climb capability; and turbulence within the downdraft can add to the
hazard.
Similarly if an aircraft flying straight and level at 60 knots encounters a
1500 feet per minute updraught the angle of attack will be increased by 15°
exceeding the critical aoa and the aircraft will stall at an airspeed higher
than the normal stall speed.
Wing loading will also change rapidly while the aoa is changing; refer to gust
induced loading in the aircraft flight envelope discussion. The faster the
aircraft's speed when encountering shear the greater the wing loading.
Generally the pilot's best option when sudden up/downdraught shear is
recognised, which may in itself take a few seconds, is to hold the aircraft's
attitude and not chase the air speed indicator, flying straight ahead until
out of the up/downdraught – bearing in mind that opposite shear will be
encountered on the other side. However should the aircraft encounter a severe
downdraught at low level the only option is to immediately apply full power
and either try to maintain height and allow the airspeed to decay or to
maintain airspeed and let the aircraft lose height. Whichever way the pilot is
in an extremely hazardous situation, indicating that recognition and avoidance
of extreme shear conditions is really the only wise option.
Low level
wind shear
Generally, below 2000 feet
agl and over flat terrain, the amount of horizontal and vertical shear, in both
direction and speed, is largely dependent on temperature lapse rate conditions:-
Greater lapse rate » greater instability » greater vertical mixing » more
uniformity of flow through layer and less shear. An exception is in extremely
turbulent conditions below a Cb.. But if the environment lapse rate exceeds
about 3 ºC per 1000 feet then convective thermal turbulence will be severe.
In stable conditions convective turbulence is minimised so that vertical shear
in the boundary layer is enhanced with highest values in the lower 300 feet,
which will affect aircraft taking off and landing. See the section in the
meteorology guide on velocity change between surface and gradient wind.
High vertical wind shear values are often attained at the upper boundary of an
inversion. An aircraft climbing through the inversion layer in the same
direction as the overlaying wind would experience a momentary loss of air speed,
and lift, through the effect of inertia, i.e. the aircraft will continue at the
same initial velocity, relative to Earth or space, until thrust increases
velocity and restores airspeed.
Thunderstorms.
Wind
shear, associated with thunderstorms, occurs as the result of two phenomena,
the gust front and downbursts. As the thunderstorm matures, strong downdrafts
develop, strike the ground and spread out horizontally along the surface well
in advance of the thunderstorm itself. This is the gust front. Winds can
change direction by as much as 180° and reach speeds as great as 100 knots as
far as 10 miles ahead of the storm. The downburst is an extremely intense
localized downdraft flowing out of a thunderstorm. The downburst (there are two types of
downbursts: macrobursts and microbursts) usually is much closer to the
thunderstorm than the gust front. Dust clouds, roll clouds, intense rainfall
or virga (rain that evaporates before it reaches the ground) are due to the
possibility of downburst activity but there is no way to accurately predict
its occurrence.
Temperature Inversions
Temperature
inversion is a condition in which
the temperature of the atmosphere increases with altitude in contrast to the
normal decrease with altitude. When temperature inversion occurs, cold air
underlies warmer air at higher altitudes. Temperature inversion may occur
during the passage of a cold front or result from the invasion of sea air by a
cooler onshore breeze. Overnight radiative cooling of surface air often
results in a nocturnal temperature inversion that is dissipated after sunrise
by the warming of air near the ground. A more long-lived temperature inversion
accompanies the dynamics of the large high-pressure systems depicted on
weather maps. Descending currents of air near the centre of the high-pressure
system produce a warming (by adiabatic compression), causing air at middle
altitudes to become warmer than the surface air. Rising currents of cool air
lose their buoyancy and are thereby inhibited from rising further when they
reach the warmer, less dense air in the upper layers of a temperature
inversion. During a temperature inversion, air pollution released into the
atmosphere's lowest layer is trapped there and can be removed only by strong
horizontal winds. Because high-pressure systems often combine temperature
inversion conditions and low wind speeds, their long residency over an
industrial area usually results in episodes of severe smog. As the inversion dissipates in
the morning, the shear plane and gusty winds move closer to the ground,
causing windshifts and increases in wind speed near the surface.
Surface Obstructions.
The irregular and turbulent flow of air around
mountains and hills and through mountain passes causes serious wind shear
problems for aircraft approaching to land at airports near mountain ridges. Wind shear is also associated
with hangars and large buildings at airports. As the air flows around such
large structures, wind direction changes and wind speed increases causing
shear.
|