weather data
When an
airplane takes flight, the type and intensity of the weather determine the
Federal Aviation Regulations (FARs), the Federal Laws, used for that flight.
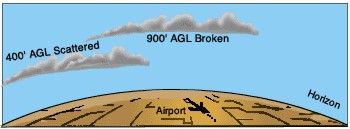
Conditions where the ceiling is more than 1,000 feet and the visibility is
greater than three miles are known as Visual Meteorological Conditions (VMC) and
Visual Flight Rules (VFR) are used. Conditions where the ceiling is less than
1,000 feet and/or the visibility is less than three miles are known as
Instrument Meteorological Conditions (IMC) and Instrument Flight Rules (IFR) are
in effect. A ceiling is the height above the Earth's surface of the lowest layer
of clouds or obscuring phenomena that is reported as "broken," "overcast," or
"obscuration," but is not classified as "thin" or "partial."
The US Weather
Service and many private organizations report and forecast the weather. It is
important for pilots and air traffic management personnel to know that a weather
report or a weather map is history and a weather forecast is a
computer-generated best guess. They must use all available weather data from
real time to forecasts before and during the flight to make decisions that
maintain safety in the skies. There are many sources of weather data, all of
which are covered briefly below. For convenience they are categorized into
printed reports and forecasts, graphic weather analyses, and briefings and
advisories. Not all are used all the time, but each provides valuable
information. For short, local flights a pilot may only need to be informed of
general weather conditions. For extended or cross-country flights, a pilot will
need more detailed information covering a greater area and perhaps at various
altitudes, too.
Printed
Reports and Forecasts
METAR is the Aviation Routine Weather
Report and is more or less standard around the world. The temperatures are given
in Celsius degrees. The atmospheric pressure however is reported in hecto
pascals everywhere, but the US where the atmospheric pressure is reported in
inches of mercury. For aviation purposes the standard temperature and
atmospheric pressure are 59° F (15°C) and 29.92 in. Hg (1013.2 hPa).
click on the blocks for explanation.
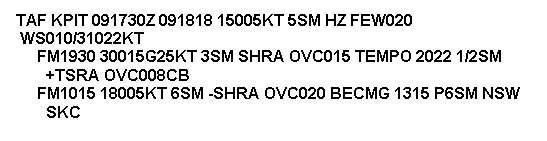
TAF is an airport forecast. TAF is more or less standard around the
world. TAF forecasts significant weather changes, temporary changes, probable
changes and expected changes in weather conditions.
click on the blocks for explanation.
The SA (surface area) report is a concise picture of the weather on
the surface where an airport weather station or other weather facility is
located (station designator). This report might contain up to the 10 separate
elements listed here.
-
Station designator (airport or other type of aviation facility)
-
Time of report and type (this could be a record observation or a special
report)
-
Sky condition and ceiling
-
Visibility
-
Weather and obstructions to vision
-
Sea level pressure (in millibars)
-
Temperature and dew point
-
Wind information
-
Altimeter setting
-
Remarks and coded data
Follow this link to
examine
an SA report.(opens in new window)
Notice to Airmen (NOTAM) may be found at the end of the SA report or
is given as separate information. This report includes timely information about
the aviation facility such as runway closures, obstructions in the approach and
departure paths to airports, outages and operational hours of the
facility.
Pilot reports (PIREPs) offer current weather conditions as reported
by pilots who have just recently flown through an area. Pilots are encouraged to
make these reports because they keep weather information updated and assist in
warning pilots in preflight of potential weather hazards along their planned
route. This report usually includes such information as height of cloud layers,
in-flight visibility, icing conditions and turbulence which sometimes confirms
what is already known, but can also inform about newly developed conditions.
Follow this link to
see
the types of information included in a PIREP. (opens in new window)
Radar Weather Reports (RAREPs) are issued by most radar stations each
hour with special reports provided as needed. This report provides information
regarding general areas of precipitation, noting thunderstorm activity. It also
includes type of precipitation, its intensity, direction and speed of activity
as well as height of rain-bearing clouds. These reports are regularly
transmitted over weather service circuits and can be found in Flight Service
station weather broadcasts.
Terminal Forecast (FT) is one of the best sources for predicting what
the weather at a particular airport (terminal) will be in the future. These
forecast predictions cover an area within 5 nautical miles of the centre of the
runway field. FTs are usually issued 3 times a day and are valid for accuracy up
to 24 hours. The first section of the FT covers the expected weather for the
upcoming 18-hour period. This includes information about ceiling, visibility,
vision obstructions, wind and expected weather changes at that facility.
Follow
this link to
examine a
sample FT report.(opens
in new window)
An Area Forecast (FA) reports the general weather conditions of a
particular region. The contiguous states are divided into 6 regions for which
area forecasts are prepared. This is a good source of weather information for en
route weather and helps to determine the weather conditions for airports that do
not provide terminal forecasts. The FA gives a 12-hour forecast plus a 6-hour
outlook with information describing 5 specific weather conditions:
Follow this link to
examine a
sample FA report.(opens in new window)
The Winds and Temperatures Aloft Forecast (FD) gives an estimate of
wind direction as it relates to true north, the wind speed (in knots) and the
temperature (degrees Celsius) for selected levels of altitude. Follow this link
to examine
an FD report.
Severe Weather Reports and Forecasts include convective outlook (AC)
and severe weather watch bulletin (WW). The AC forecasts general thunderstorm
activity for the 24-hour period after the report is issued. The WW defines areas
where thunderstorms or tornadoes have the possibility of developing.
Graphic Weather Analyses
Flight Service Stations and weather
services offices offer a wide variety of pictorial views of the weather. These
charts and maps provide lots of information on large-scale weather patterns and
trends.
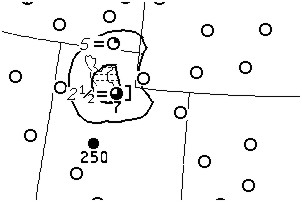
Surface Analysis Chart (or Surface Weather Chart) depicts
the weather conditions as they were a few hours earlier to the time stamped on
the chart. These charts are developed every 3 hours. Reviewing this chart gives
a picture of atmospheric pressure patterns, locations of high and low pressure
systems as well as frontal movements.
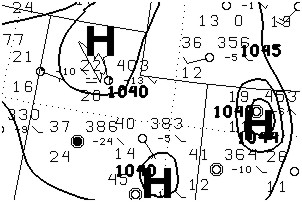
Click the image to view the
entire chart.
(opens in new window)
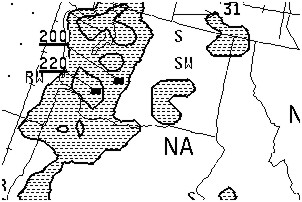
Perhaps the most useful information to a pilot planning a flight during
pre-flight is the Weather Depiction Chart. This is actually is a
simplified version of the weather surface chart. This chart is also generated
every 3 hours. It contains information on frontal activity and has an
abbreviated version of station models. It does not contain as much detailed
information as the surface weather chart, but offers pilots a way to easily and
quickly scan for adverse weather conditions.
Click the image to view the entire
chart.
(opens in new window)
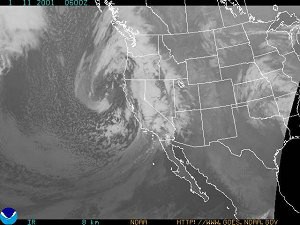
Special weather radar systems can detect certain types of weather phenomena.
These radar systems emit pulses of radar energy from a rotating antenna. If the
signals encounter precipitation, they are reflected back to the antenna as
echoes. These are then graphically depicted displaying the strength and location
of the precipitation. This radar detection does not detect all cloud formations,
only frozen or liquid forms of precipitation. It will not detect fog or the
actual tops of rain clouds. The radar summary chart has limitations in that it
only displays the conditions that existed at the time recorded on the chart.
Remember that thunderstorms can develop rapidly and recently developed
thunderstorms might not be displayed.
Click the image to view the
entire chart.
(opens in new window)
The low level significant weather prognostic chart is different from the
three previous charts described in that it is a forecast chart (not an
observation chart). The "prog" chart is issued 4 times daily and provides a
12-hour and a 24-hour weather forecast for a given region. It also only covers
from the surface up to the 400-millibar pressure level (24,000 feet in
altitude). It is to be used only in planning flights below 24,000 feet.
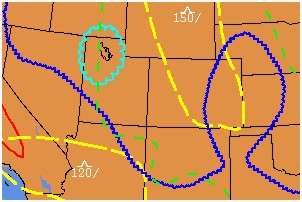
Click the image to view the entire
chart.
(opens in new window)
Briefings and Advisories
Whether a commercial, military or
private pilot, all must obtain a formal weather briefing during preflight. Based
upon the following pilot's information a briefing is given:
-
type of flight (VFR or IFR)
-
aircraft type
-
departure and destination airport
-
flight route
-
flight altitudes
-
estimated time of departure (ETD)
-
estimated time of arrival (ETA)
There are three types of briefings that are offered to pilots by "pilot
weather briefers" who have been certificated by the National Weather Service.
These "briefers" can be contacted at local Flight Service Stations and Weather
Service Offices. Pilots need to know which weather briefing to request when
contacting "briefers." There are standard, abbreviated and outlook
briefings.
The Standard Briefing is the most complete weather briefing
and for the pilot who does not have an opportunity to gather any other weather
data, gives the following information:
-
adverse conditions
-
VFR (visual flight rules) flight not recommended
-
synopsis
-
current conditions
-
en route forecast
-
destination forecast
-
winds aloft
-
notices to airmen (NOTAM)
-
ATC (air traffic control) delays
The Abbreviated Briefing is for pilots who need to update previous
weather data they have gathered. Pilots also use this briefing when they only
need a few bits of weather data to complete their weather picture.
The Outlook Briefing is requested by pilots whose departure time is 6
or more hours away. The briefer then gives forecast information appropriate to
the proposed flight route. This will assist the pilot in making an initial
decision about the feasibility of such a flight.
Because of the quickly growing number of flight operations daily there is a
tremendous demand for weather information services. Because of this demand, many
weather information services are recorded. Pilots can use a telephone to get
preliminary weather information and decide, based upon that information, if he
or she needs to speak with a briefer. There are various automated systems
available with one such system , the Pilots Automatic Telephone Weather
Answering Service (PATWAS), offers a continuous weather recording that gives
a summary of weather data for an area within 50 nautical miles of the station.
This information will help pilots in their decision-making process for a
"go/no-go" decision.
While en route on a flight there are many in-flight weather advisories
available to pilots via radio frequencies. The weather information provided
helps pilots during their en route decision-making processes. The pilot uses the
weather information to determine whether or not the conditions may be hazardous
to the flight. It also helps the pilot working with air traffic management
personnel to decide on a change in the flight plan.
AIRMET (WA) is
broadcasted for weather phenomena that potentially affects all aircraft. For
pilots of light aircraft, AIRMET (acronym for "AIRman's METeorological
information) gives valuable information about the following conditions: moderate
icing, moderate turbulence, sustained winds 30 knots or greater at the surface,
widespread area with a ceiling of less than 1,000 feet and/or visibility less
than 3 miles and extensive obscurement of mountains. These are important to
light aircraft, as they have limited flight capabilities due to lack of
equipment and/or instrumentation and less pilot flight experience. Follow this
link to
examine
a sample AIRMET.(opens
in new window)
SIGMETs (WSs) are broadcasted for hazardous weather that is considered
of extreme importance to all aircraft. SIGMETs (acronym for "SIGnificant
METeorological information") warn of the following weather hazards: severe
icing, severe and extreme turbulence, duststorms, sandstorms or volcanic ash
lowering visibility to less than 3 miles. A Convective SIGMET (WST) is issued
for hazardous convective weather (such as tornadoes, thunderstorms, hail) and
covers severe or great turbulence, severe icing, and low-level wind shear.
Follow this link to
examine
a sample SIGMET.(opens in new window)
|