Sectional
Charts are meant to only show a section of a flight region. These charts
emphasize only landmarks and features that would be important to a pilot for
navigation during flight. Tall, man-made structures and natural landmarks are
indicated along with roadways, rivers and railroad tracks, as these are easily
seen and recognized by pilots from the air. Topography is referenced by a
special colour code with lightness or darkness of the colour indicating a lower or
higher in elevation of the land.
Take a look at the Sectional Chart below and notice how much information it
communicates to the pilot. We'll break this Sectional Chart down into layers, so
you can easily see how the many important features are noted on the chart. Check
the button for any given layer to view that layer; uncheck it to hide the layer.
Select any combination of layers to place them together, so you can view the
sectional chart in different ways.
There are a
number of important components to this chart. Let's examine them in detail.
Elevation
Notice the use of colour to show elevation. The colour code
is given in the box next to the chart. Remember, the darker the shade, the
higher the elevation. The lighter the shade, the lower the elevation. Bright
yellow indicates a city.
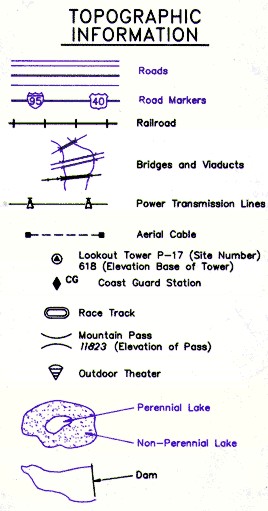
Topography
This layer shows the man-made and natural features that would be easily visible
to a pilot during flight. The man-made features include tall towers, roads,
railroad tracks, dams, outdoor theatres, race tracks, bridges, lookout towers,
power transmission lines, aerial cables, and coast guard stations. The natural
features include lakes, rivers and mountain passes.
Obstructions
These man-made structures are usually tall radio
towers, simply tall towers or they are very tall structures that are not
specifically identified on the map. See the key below.
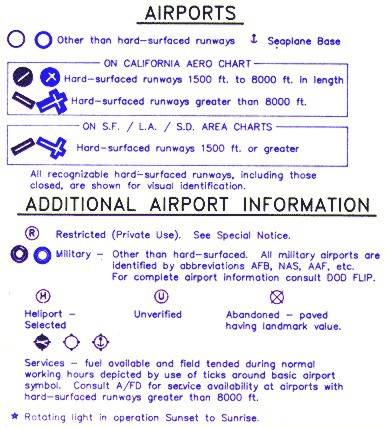
Airport Information
An airport is
indicated by the type and length of runway it has. There are also special
symbols to indicate if the airport is restricted in any way, if it is a military
airport, if it has been abandoned and if it provides services such as fuel.
Airports having control towers are shown in blue. Additional data about the
airport is given in a blue-lined box. All other airports are shown in magenta.
For specific details about an airport, the pilot needs to consult the Airport
Facility Directory. Click the key below for a closer view.
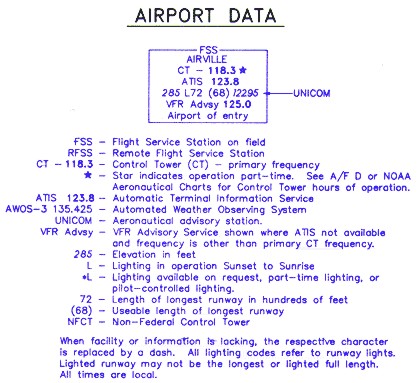
Airport Data
The blue-lined box
gives details about the airport indicated in blue. (Remember blue airports have
control towers!) This data can be lengthy or brief and usually includes radio
frequencies, elevation, runway length and lighting availability. Click the key
below for a closer view.
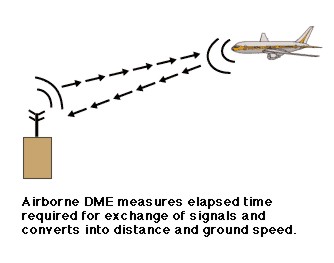
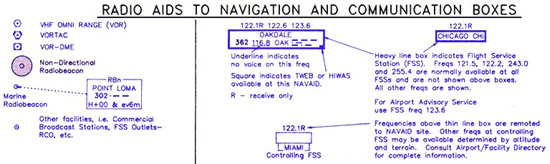
Radio Aids
The symbols listed in the box
below inform pilots as to what radio aids are available for their navigation.
Click the box for a closer view.
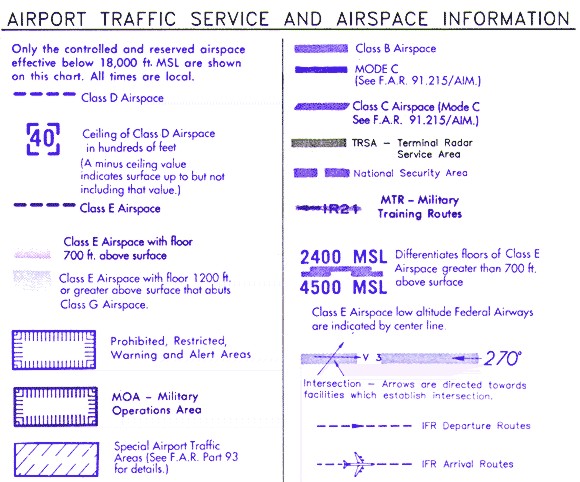
Airspace Information
The type of
aircraft being flown will determine the airspace in which it should be flown.
The floor and/or ceiling for each different airspace designation is sometimes
indicated on the chart. Airways, departure and arrival routes are also drawn on
the map. Restricted areas and military operation areas are boxed in blue or
magenta. Click the box below for details.
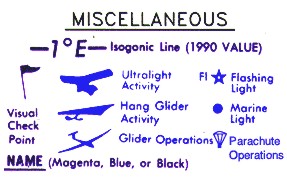
Miscellaneous
These symbols show special activity that can
occur in a certain area such as ultra-light flying, hang gliding, parachuting and
glider operations. If an airport has a flashing beacon, it is also indicated.
See the key below for these symbols.
Text
All names are printed in black, blue or magenta and can
indicate cities, mountains, rivers and regions.
Compass
Throughout a sectional chart a compass rose is placed to
identify to the pilot the orientation to the cardinal points (north, south, east
and west).